Does Rose Water Have a Frequency? We Measured Akita Non-De-Oiled Rose Water
Have you ever wondered, “What is the frequency of rose water?”
If you search online for rose oil and frequency, you will often come across the number 320 MHz. There is, however, an important distinction: this widely circulated claim has been associated with Rosa damascena flower oil, not rose water.
That raised another question for us.
What happens when the naturally carried oil fraction is not separated from the rose distillate? Does Akita Non-De-Oiled Rose Water show one particular frequency when measured?
We decided to investigate.
The result was more interesting than a single number:
We did not find one frequency. We found a reproducible frequency fingerprint.
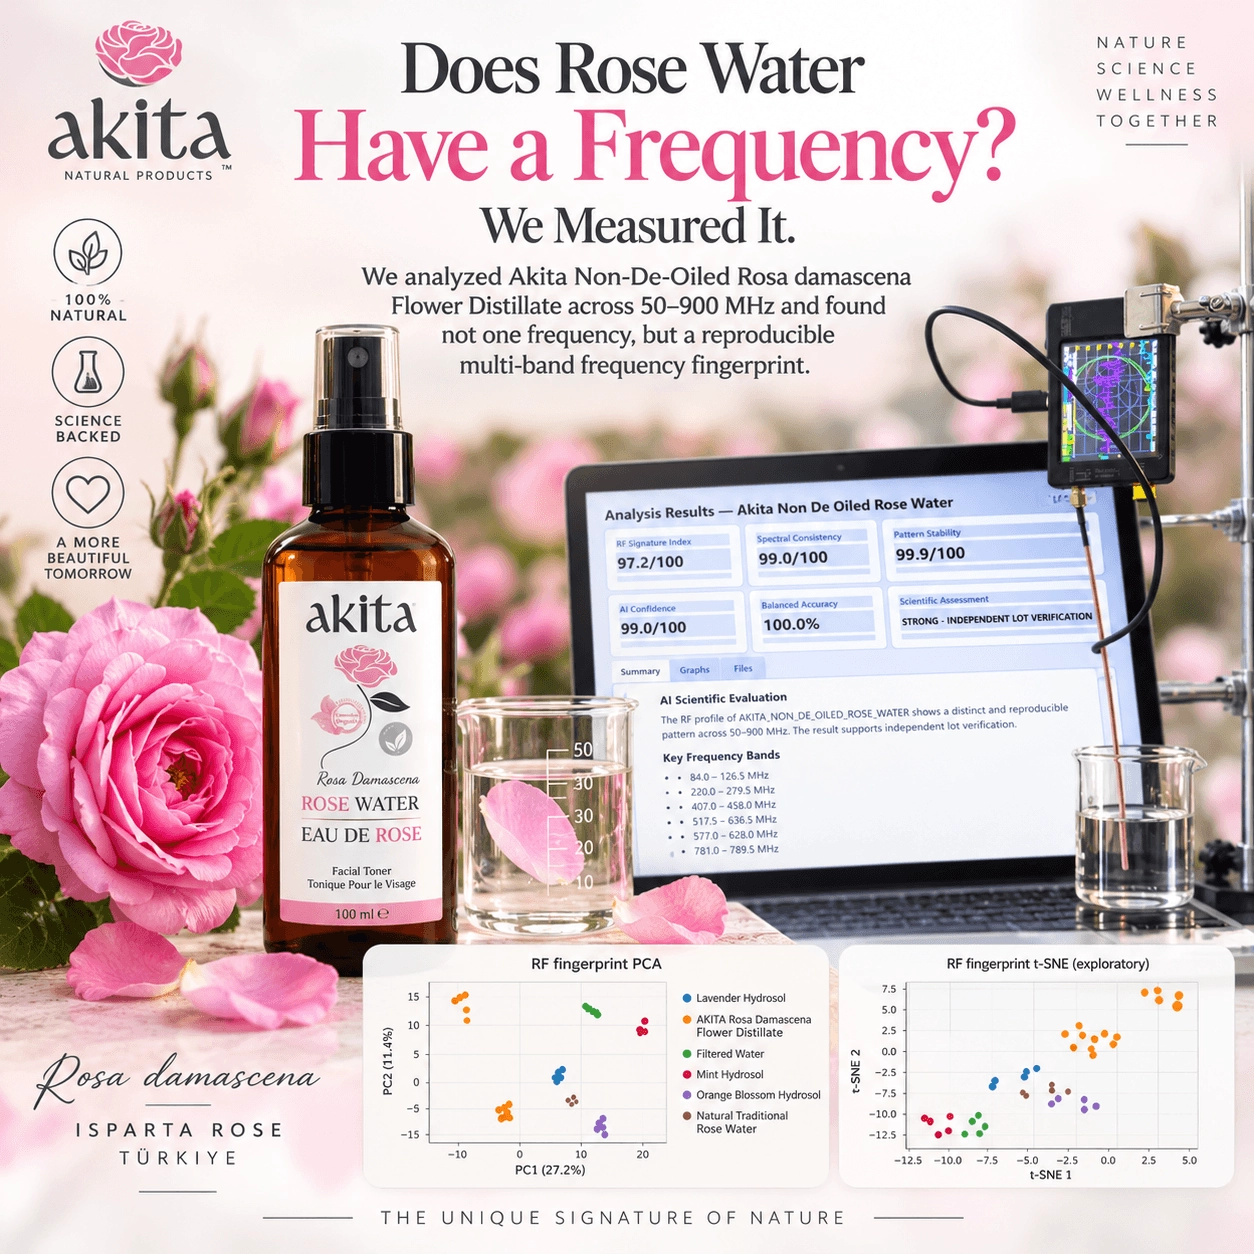
In Akita's study, Non-De-Oiled Rosa damascena Flower Distillate was examined across 50–900 MHz. The study did not find one isolated characteristic peak at 320 MHz. Instead, discriminative information appeared across multiple frequency regions, producing a reproducible multi-band measurement profile that separated from the other liquids tested in the dataset.
First, an Important Difference: Rose Oil and Rose Water Are Not the Same
When rose flowers are distilled, volatile compounds are carried with the steam. In conventional production, the volatile oil phase can be separated to obtain rose oil, leaving behind the water-based distillate commonly known as rose water.
Akita Non-De-Oiled Rose Water is different.
With Akita's approach, the naturally carried oil fraction is not separated from the flower distillate. In the research, this product is identified as AKITA Rosa Damascena Flower Distillate.
This led to the central research question:
Does this distinct rose distillate behave at one frequency, or does it produce a broader, reproducible frequency pattern?
Why Didn't We Look Only at 320 MHz?
Looking only for a predetermined number could mean overlooking what is happening across the rest of the frequency spectrum.
Akita engineers therefore investigated the product across a much broader range: 50 to 900 MHz.
The measurement protocol was standardized. Each measurement used 40.0 mL of sample in a 50 mL glass beaker. Probe depth and position were controlled, and five independent measurements were performed per sample under the same measurement geometry.
Instead of asking only, “Can we find 320 MHz?”, the research asked a broader question:
How does the measurable electromagnetic response of the liquid behave across the entire frequency range?
The Result: Not One Frequency
This is where the study became particularly interesting.
The research did not identify a single characteristic frequency that would justify saying:
“The frequency of Akita Non-De-Oiled Rose Water is 320 MHz.”
Instead, discriminative information appeared across several frequency regions.
The study highlighted regions including:
- 84–126.5 MHz
- 220–279.5 MHz
- 407–458 MHz
- 517.5–636.5 MHz
- 577–628 MHz
- 781–789.5 MHz
There is an important distinction here.
These bands should not be interpreted as six “natural frequencies” or isolated resonance frequencies of Akita Rose Water. The white paper describes them as regions where discriminative information became concentrated in the statistical and machine-learning analysis.
In other words, the overall pattern matters more than any one number.
What Is a Frequency Fingerprint?
Think about how we recognize a person.
We do not normally identify someone from a single feature such as height. We recognize a combination of features—the face, voice, eyes, movements and many other characteristics.
A frequency fingerprint can be understood in a similar way.
Instead of looking at how a liquid behaves at just one frequency, we examine its measurable response across a broad frequency range.
The resulting pattern can contain more information about a sample than a single frequency value.
That is what makes the Akita findings interesting:
The discriminative information was not concentrated at one point. It appeared across multiple frequency regions.
Did the Other Waters Show the Same Pattern?
This is one of the most interesting parts of the study because Akita Non-De-Oiled Rose Water was not measured alone.
The experimental dataset included:
AKITA Rosa Damascena Flower Distillate, Natural Traditional Rose Water, Lavender Hydrosol, Mint Hydrosol, Orange Blossom Hydrosol and Filtered Water.
A total of 40 measurements were evaluated. The Akita target class included 15 measurements from the 2023, 2024 and 2025 production years.
Within this experimental dataset, the Akita distillate separated from all of the tested comparison liquid classes.
Importantly, this separation was not dependent on one frequency point.
The Computer Could See the Separation Too
The measurements were not evaluated simply by looking at individual graphs.
Akita's Python-based analysis platform used statistical analysis and machine-learning methods to examine the structure of the data.
One example is PCA, or Principal Component Analysis. In simple terms, PCA helps researchers visualize complex datasets so that similarities and differences between groups can be easier to see.
In the PCA plot presented on page 8 of the Akita RF Discovery White Paper, the Akita target measurements occupy a separate region from the tested comparison liquid classes.
The study also used an exploratory technique called t-SNE. Here again, the Akita measurements occupied a separate region without overlapping the comparison classes in that visualization.
However, the white paper makes an important scientific distinction: t-SNE is an exploratory visualization and should not be treated as independent proof of classification performance.
Even More Interesting: Three Production Years Were Examined
Natural products are not produced under perfectly identical natural conditions every year.
Growing conditions, harvests and production lots can vary.
For that reason, Akita samples from 2023, 2024 and 2025 were included in the study.
This allowed another question to be explored:
When the production year changes, does a common frequency identity remain?
Within the current dataset, measurements from different production years showed a common primary identity, although the white paper notes that aging- or lot-related sub-variation may also exist.
This opens another interesting area for future research using larger datasets and additional production years.
So, What Does All of This Mean?
Perhaps the most important conclusion is what the study does not say.
The result is not:
“Akita Non-De-Oiled Rose Water has a frequency of 320 MHz.”
The current findings point to something more complex.
A more accurate description is:
Within the current 50–900 MHz experimental dataset, Akita Rosa Damascena Flower Distillate was characterized not by one 320 MHz peak, but by a reproducible multi-band frequency fingerprint that separated from the tested waters and hydrosols.
What Does This Research Not Show?
Scientific research is not only about explaining what was found. It is equally important to explain what the results cannot yet tell us.
This study does not demonstrate that the observed frequency regions have a particular effect on the skin, brain, mood or human health.
It also does not establish that an individual frequency band can be assigned directly to a particular molecule.
The Akita white paper specifically states that these findings are not evidence of therapeutic or biological effects. It also notes that blinded, randomized, independent-laboratory and external hold-out validation would be needed before this approach could be considered for routine authentication.
For the same reason, the results should not be interpreted as meaning that “higher frequency means better, healthier or more powerful.”
The scientific question here is different:
Can the measurable frequency behaviour of a botanical distillate across a broad spectrum produce a distinctive and reproducible pattern?
Akita's current findings suggest that this is a question worth investigating further.
Beyond 320 MHz: A New Question
We began with a simple question:
What is the frequency of Akita Non-De-Oiled Rose Water?
But the research led us to a more interesting one:
What if a natural distillate is better characterized not by one frequency, but by an entire frequency fingerprint?
That is the central finding of the current Akita RF Discovery research:
We did not find one frequency. We found a reproducible frequency fingerprint.
And this may not be the end of the research.
It may be the beginning.
Frequently Asked Questions
1. Does rose water have a frequency?
The electromagnetic behaviour of a liquid can be measured across specified frequency ranges. In the Akita study, Non-De-Oiled Rosa damascena Flower Distillate was examined from 50 to 900 MHz. The results did not identify one defining frequency. Instead, they revealed a reproducible pattern distributed across multiple frequency regions.
2. What is the frequency of Akita Non-De-Oiled Rose Water?
According to the current study, it would not be accurate to assign Akita Non-De-Oiled Rose Water one MHz value. Discriminative information was concentrated across several regions, including 84–126.5 MHz, 220–279.5 MHz, 407–458 MHz, 517.5–636.5 MHz, 577–628 MHz and 781–789.5 MHz. These should be interpreted as discriminative frequency bands, not individual natural or resonance frequencies.
3. Is the frequency of Akita Rose Water 320 MHz?
No. The current research did not find a characteristic 320 MHz peak. The widely circulated 320 MHz claim has historically been associated with Rosa damascena flower oil, rather than conventional rose water. Akita's research examined the entire 50–900 MHz range instead of attempting to confirm one predetermined number.
4. What does “frequency fingerprint” mean?
In simple terms, rather than looking at a liquid's response at one frequency, researchers examine its measurable behaviour across a broad range of frequencies. In the Akita study, discriminative information appeared across several frequency regions, creating a multi-band pattern rather than one isolated peak.
5. Did Akita Non-De-Oiled Rose Water show a different frequency fingerprint from other waters?
Within the current experimental dataset, yes. Akita Rosa Damascena Flower Distillate was compared with Natural Traditional Rose Water, Lavender Hydrosol, Mint Hydrosol, Orange Blossom Hydrosol and Filtered Water. The Akita target class separated from the tested comparison classes. This does not mean that every rose water or hydrosol on the market has been tested.
6. Were Akita Rose Waters from different production years tested?
Yes. Samples representing 2023, 2024 and 2025 were included in the target class. Within the current dataset, measurements from different production years showed a common primary identity, although aging- or lot-related sub-variation may exist.
7. Does a higher frequency mean better or more beneficial rose water?
The study does not support that conclusion. It does not establish that a higher frequency makes a product healthier, more effective or higher quality. The research examined whether measurable frequency behaviour could distinguish the tested liquid samples.
8. Do these frequencies affect the human body or skin?
This research does not demonstrate that the measured frequency regions have therapeutic or biological effects on the skin or human body. Establishing such effects would require separately designed biological and clinical research.
9. Can frequency measurements be used to authenticate rose water?
The findings suggest an interesting research direction, but the method should not yet be described as a validated routine authentication test. The white paper states that blinded, randomized, independent-laboratory and external hold-out validation would be required for routine authentication.
10. Why is Akita researching the frequency of rose water?
The purpose is not simply to confirm a popular frequency claim. Akita is investigating the measurable electromagnetic behaviour of its Non-De-Oiled Rosa damascena Flower Distillate across a broad frequency range. The current findings indicate that studying a multi-band frequency fingerprint may be more informative than assigning the product a single frequency value.
Comment